Part of the FastTrack Platform

Fibonacci Retracement Scanner

Scan your entire watchlist for Fib levels, recovery status, and breakout candidates. Click any ticker to see auto-calculated charts. No manual drawing—ever.

Try FastTrack Free

No credit card required · 14-day free trial · Cancel anytime

Manual Fibonacci analysis doesn't scale.

You know the frustration. Drawing retracement levels one ticker at a time. Guessing where to anchor the high and low. Losing track of recovery status across your portfolio.

What if you could scan hundreds of tickers instantly—then click any one to see auto-calculated Fib charts?

The Old Way
The FastTrack Way

1 ticker at a time

Draw levels manually on each chart

500+ tickers at once

All levels pre-calculated instantly

Subjective anchors

Where do you draw the high/low?

Objective anchors

Algorithm finds max drawdown points

Can't compare

No way to rank recovery status

Normalized rankings

Sort by Bull Rank or Bear Rank

Charts need manual drawing

Pick anchors, draw lines, repeat

Charts auto-calculate

Click any ticker—levels appear instantly

Scan. Click. Confirm.

Find candidates in the spreadsheet. Visualize levels on the chart. No drawing required—ever.

Step 1: Scan
Fibonacci Scanner spreadsheet view

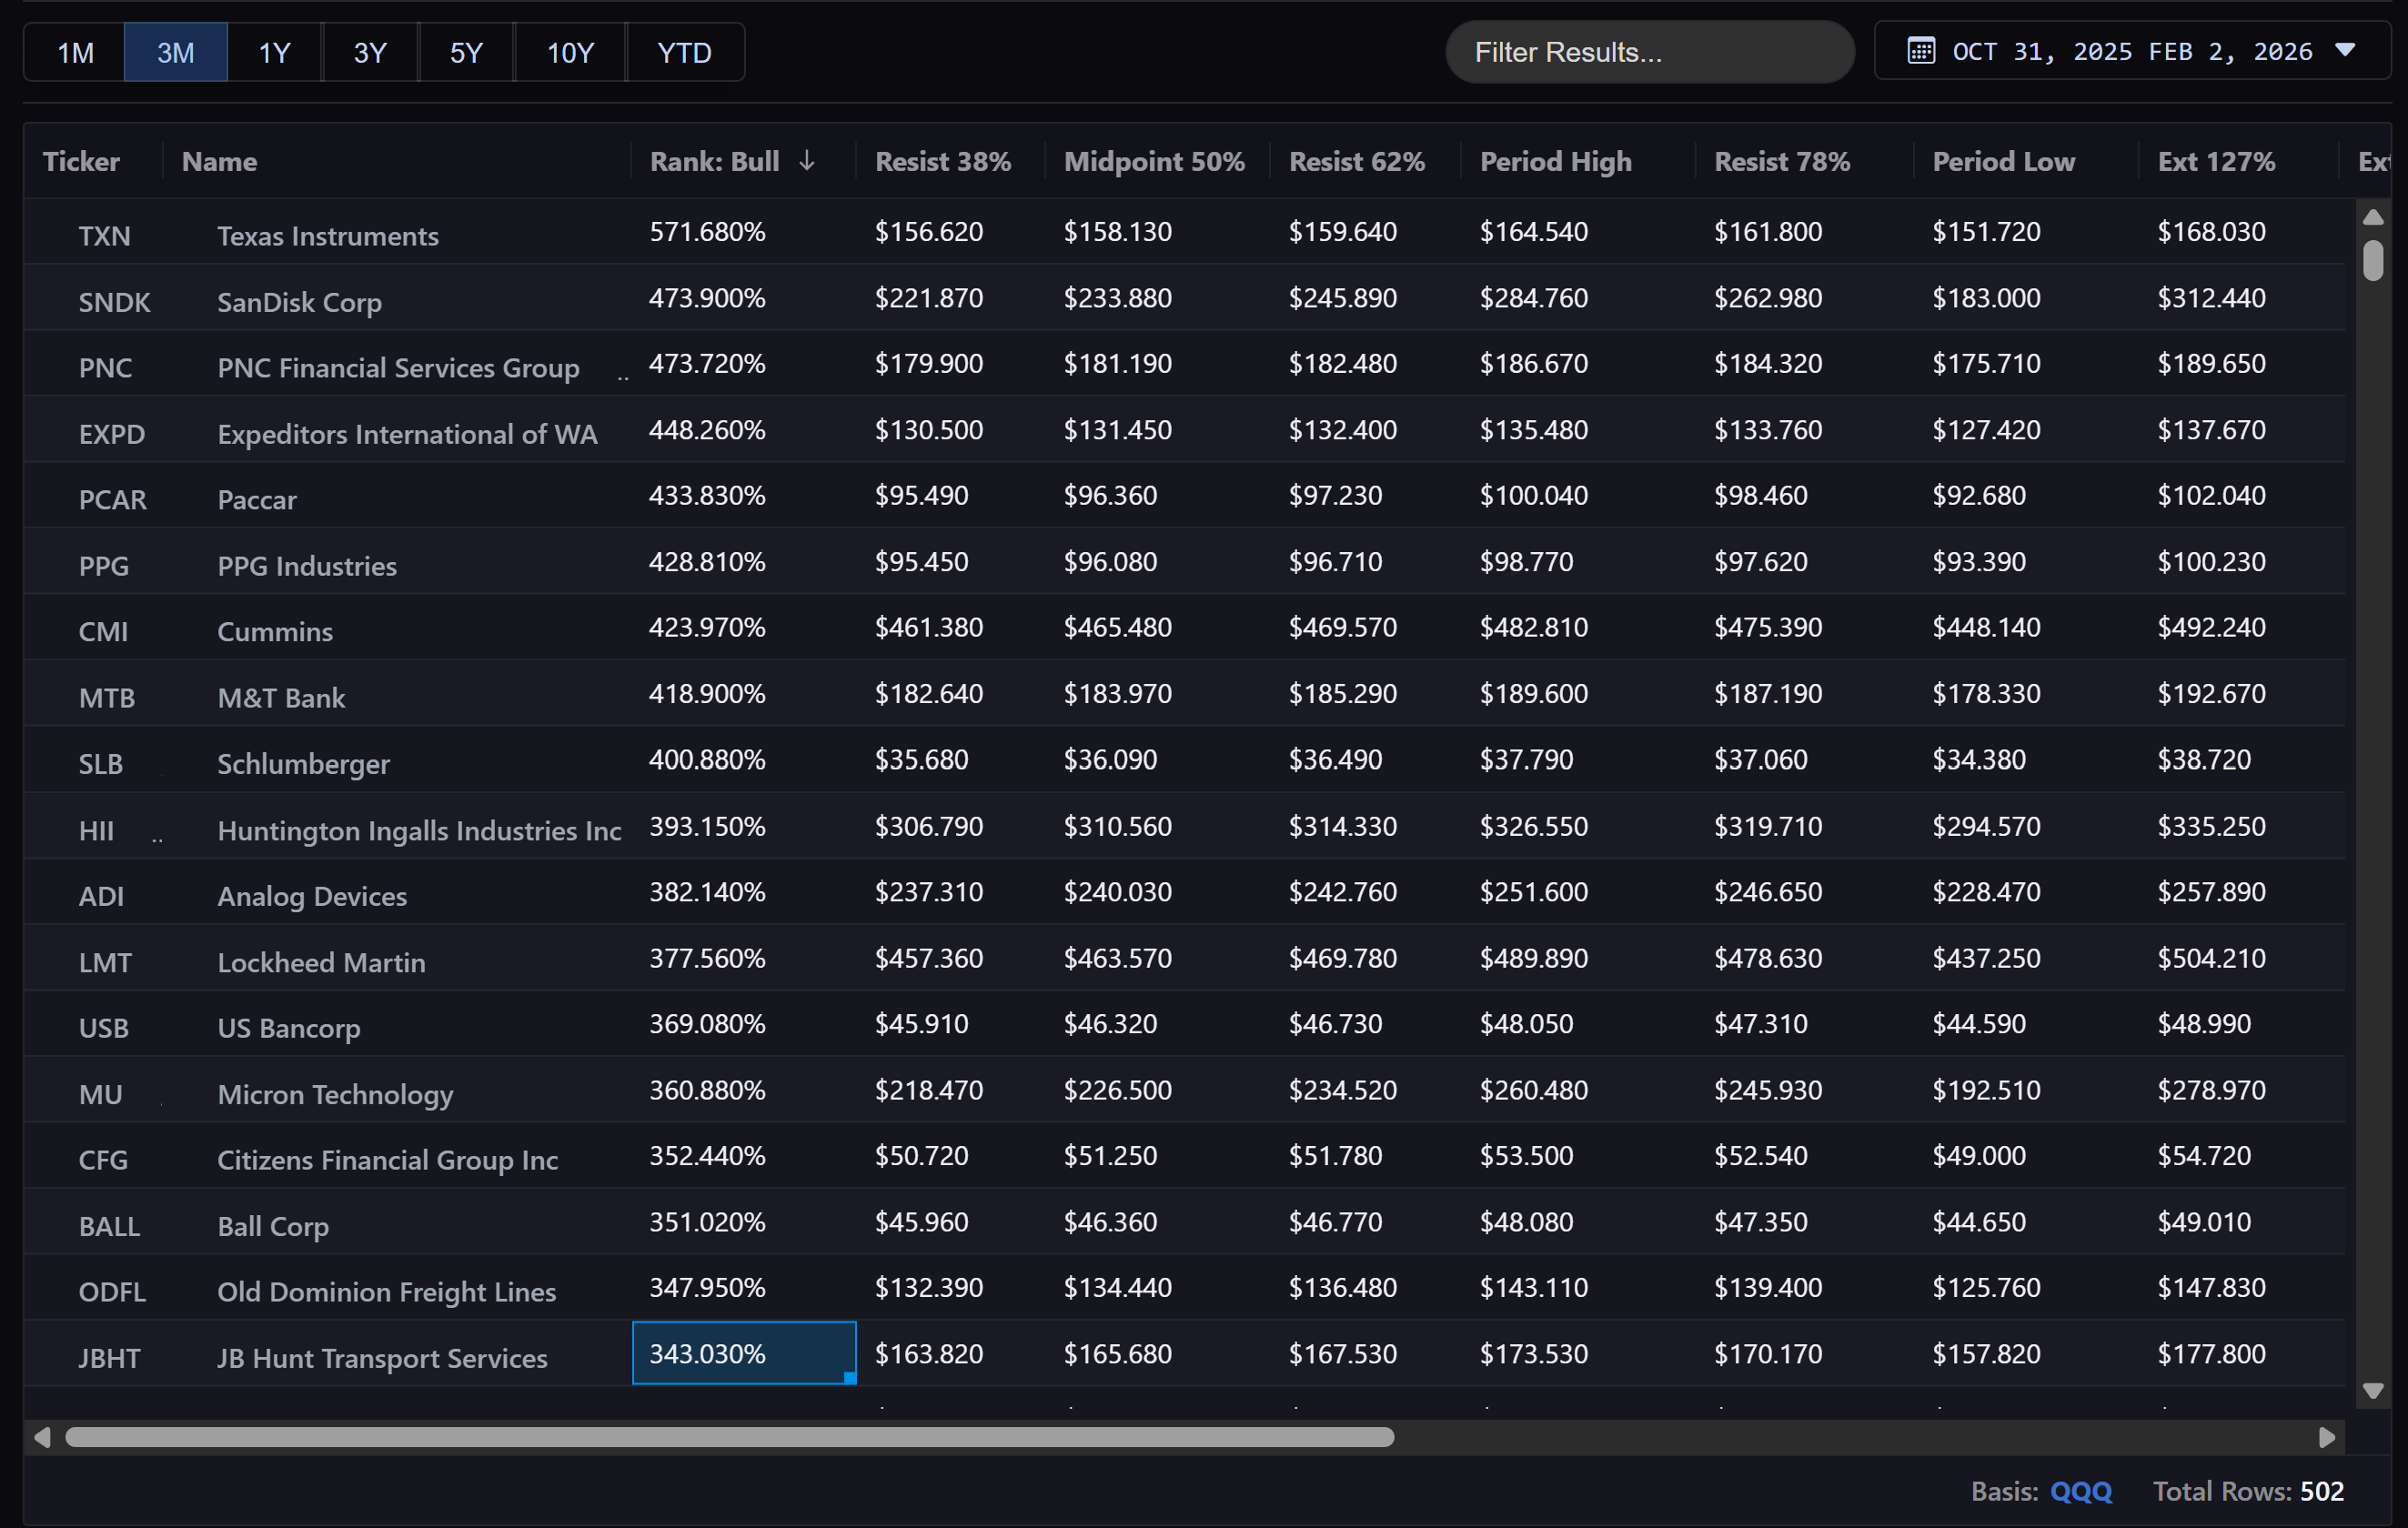
Filter 500+ tickers by Fib levels, recovery %, or rank

Step 2: Confirm
Fibonacci chart with auto-calculated levels

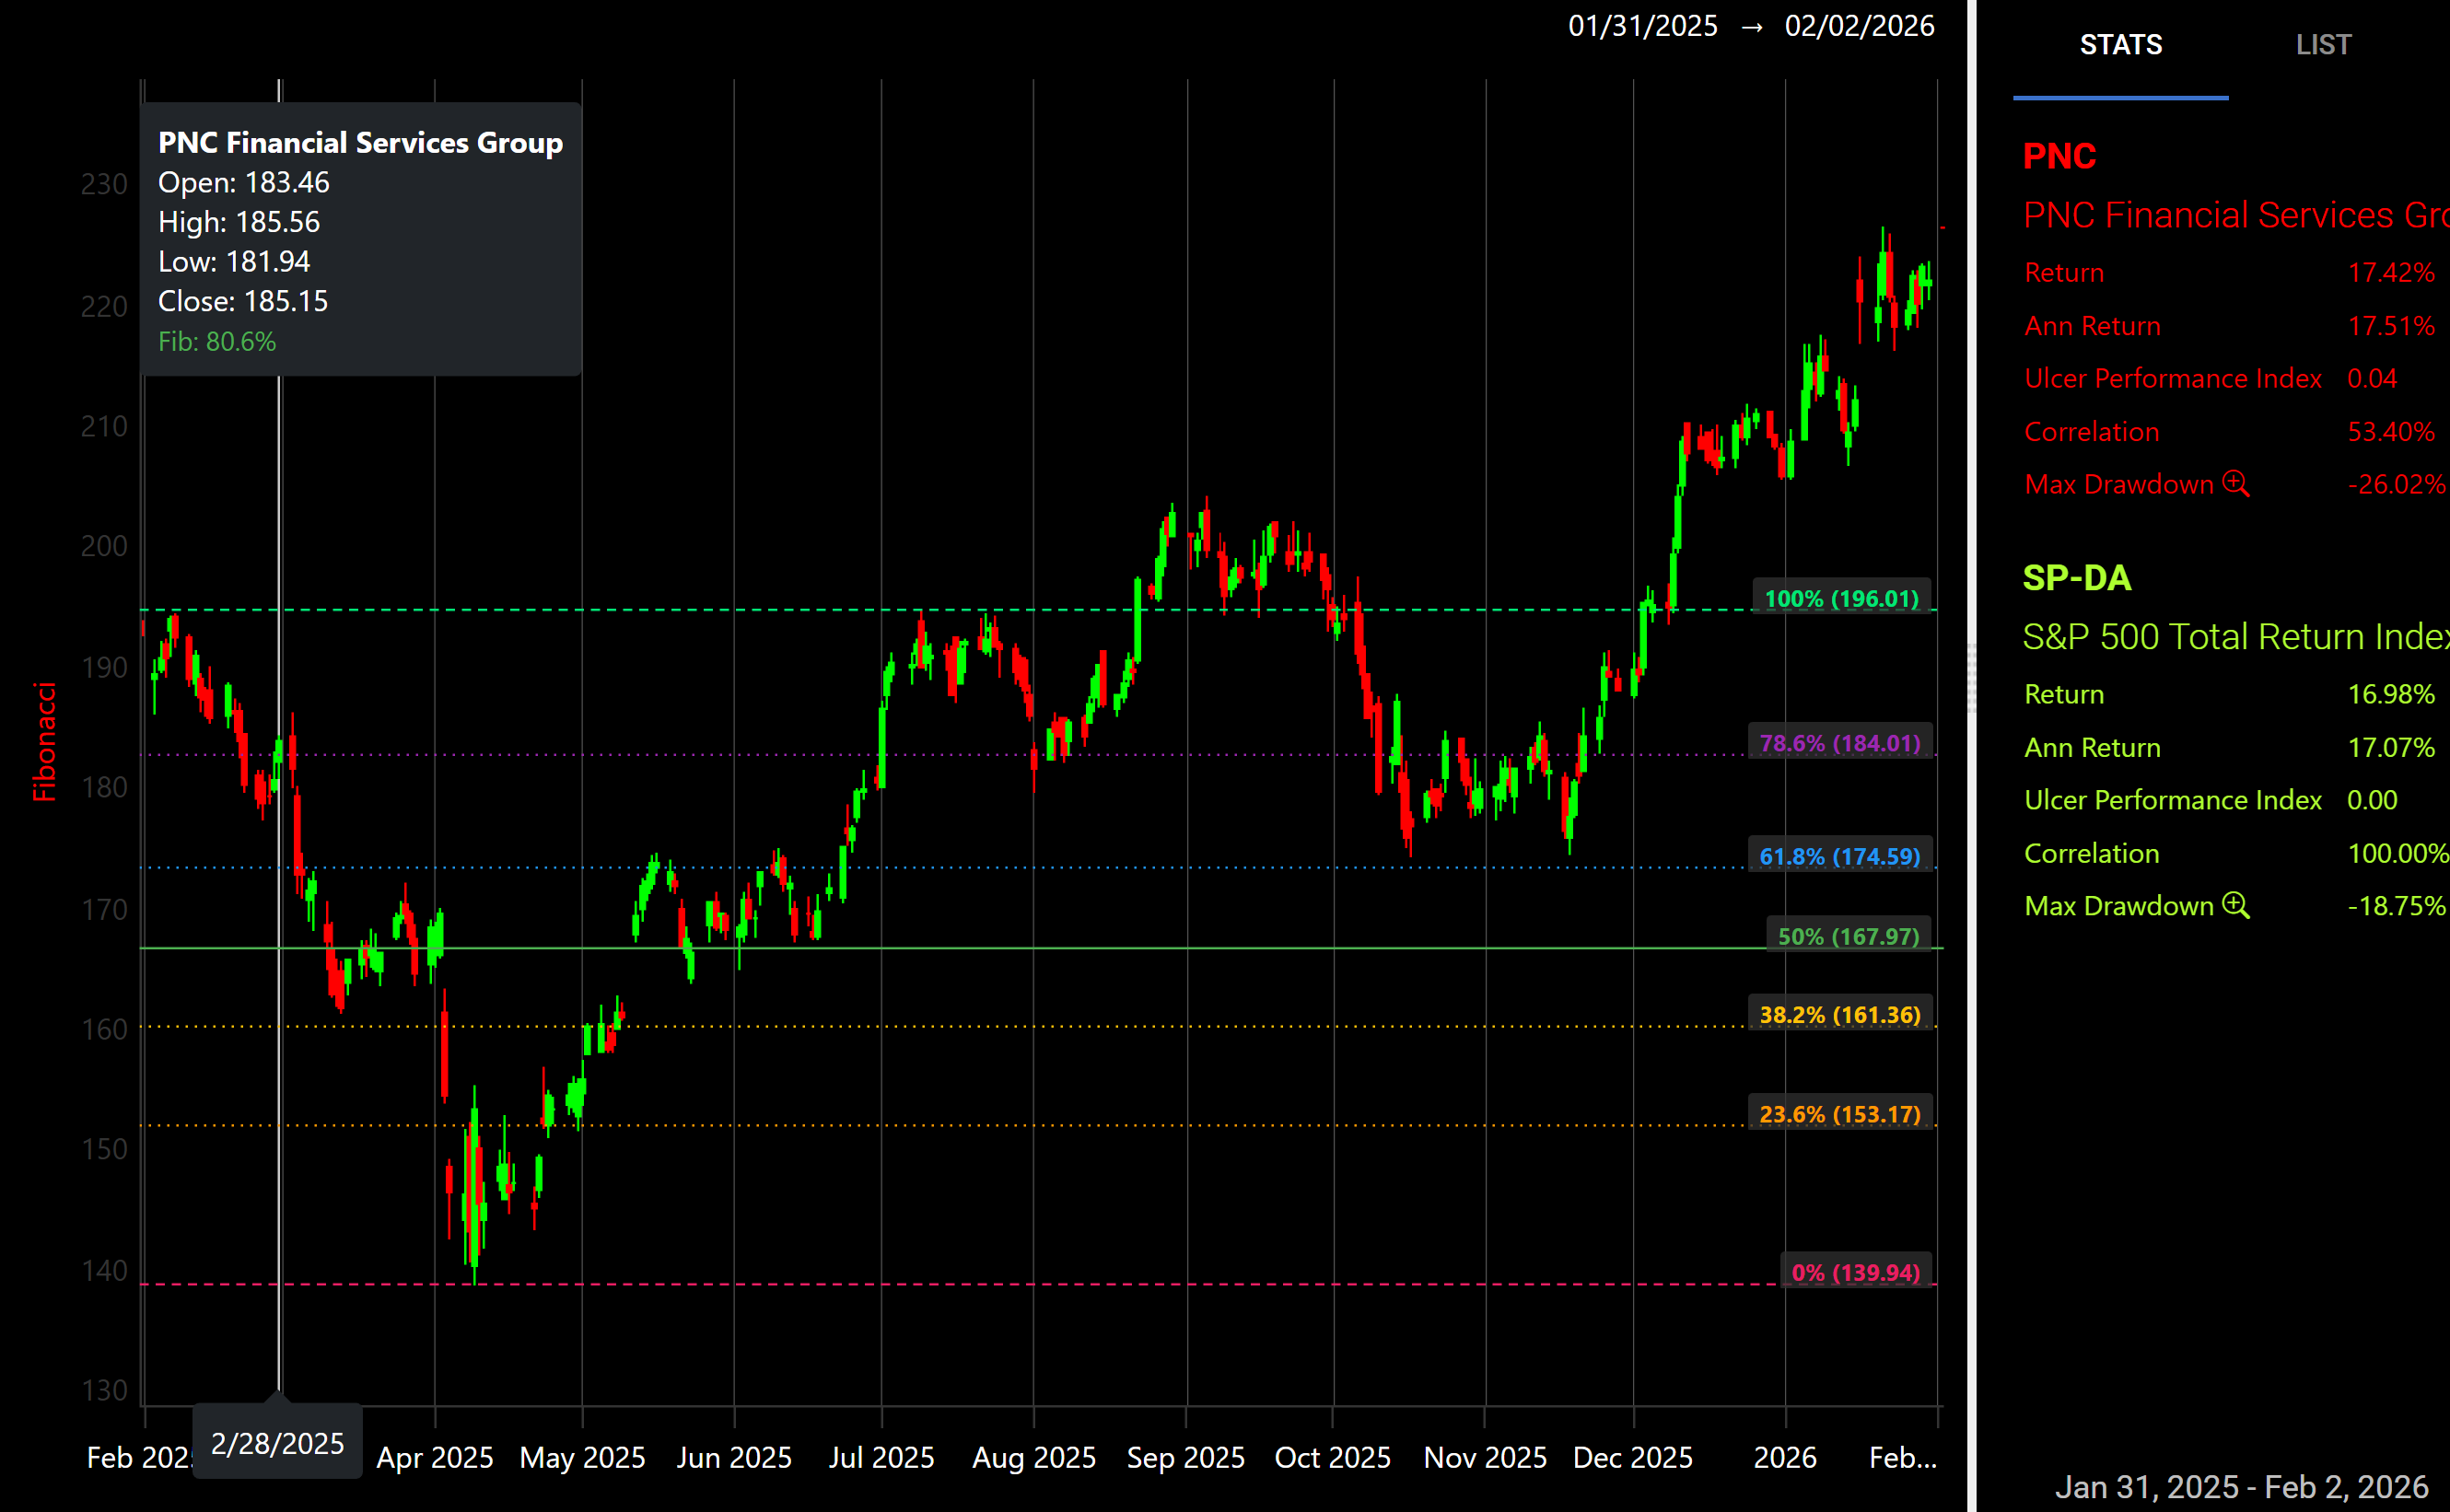
Click any ticker—Fib levels drawn automatically

1

Support Levels

23.6%, 38.2%, 50%, 61.8%, 78.6% calculated from period high

2

Resistance Levels

Bounce targets calculated up from period low

3

Recovery Status

% Recovered, Recovery High, Secondary Drawdown

4

Dynamic Recalc

Change date range—levels update automatically

Built for Serious Fib Traders

Everything you need to systematize your Fibonacci analysis.

Batch Scanning

Analyze your entire watchlist, an index, or custom portfolios. No more one-by-one charting.

Intraday Anchors

Uses actual intraday highs and lows—not just closing prices. Captures the "true" range where orders sit.

Sortable Rankings

Rank: Bull finds breakout leaders. Rank: Bear finds deep value. Normalized 0-100% scores for any universe.

Recovery Tracking

See where price is in the recovery cycle. Track Recovery High and secondary drawdowns.

Extension Targets

127.2%, 161.8%, 261.8% levels for breakout price targets above the old high.

Auto-Calculated Charts

Click any ticker to see Fib levels visualized. No drawing. Levels update automatically when you change date ranges.

And That's Just the Beginning

Fibonacci analysis is one of 100+ data columns in the FastTrack platform. Here's what else you get:

Performance Analytics

Returns, alpha, beta, Sharpe ratio, Sortino, and more—calculated for any time period.

Risk Metrics

Max drawdown, standard deviation, downside capture, and correlation analysis.

Portfolio Comparison

Compare any securities side-by-side. Build custom portfolios with rebalancing.

Technical Signals

Moving averages, crossovers, momentum indicators—all as sortable columns.

Explore the full platform →

20+ Fibonacci Data Points Per Ticker

Setup & Anchors

  • Period High Intraday peak price
  • Period Low Intraday bottom price
  • Max DD % High-to-low decline
  • DD Length Trading days peak to valley
  • Current Price Live position
  • % Recovered 0% = bottom, 100% = top

Support Levels (Pullback)

  • Supp 23.6% Shallow pullback
  • Supp 38.2% Trend continuation zone
  • Midpoint 50% Psychological level
  • Supp 61.8% Golden ratio / deep value
  • Supp 78.6% Last stand

Resistance Levels (Bounce)

  • Resist 23.6% Dead cat bounce zone
  • Resist 38.2% Common failure point
  • Resist 61.8% Make or break level
  • Resist 78.6% Near full recovery

Extensions & Rankings

  • Ext 127.2% Over-extension / retest
  • Ext 161.8% Golden target
  • Ext 261.8% Parabolic target
  • Rank: Bull Momentum scan (0-100%)
  • Rank: Bear Value scan (0-100%)

How Traders Use It

Find Breakout Leaders

Sort by Rank: Bull (descending) to find stocks that have recovered most of their losses and show relative strength.

Hunt Deep Value

Sort by Rank: Bear (descending) to find oversold stocks still near their lows—potential mean-reversion plays.

Monitor Portfolio Health

Load your holdings. See which positions are losing recovery momentum (Recov DD % increasing).

Identify Entry Points

Filter for stocks trading near the 61.8% support—the "golden ratio" entry zone for trend followers.

Set Profit Targets

For breakout positions, use the 127.2% and 161.8% extensions as systematic exit levels.

Compare Across Sectors

Normalized rankings let you compare recovery status of a mega-cap vs. small-cap instantly.

35+
Years of Market Data
Trusted since 1988
40K+
Securities Covered
Stocks, ETFs, Mutual Funds
20+
Fib Data Points
Per ticker, per time period
2 sec
Full Scan Time
Not 2 hours

"What's really useful is the recovery information moving forward from the maximum drawdown—this is the main area of interest for active managers. We couldn't find this anywhere else."

David W.

Active Portfolio Manager

Full Access to Fibonacci Analysis

Plus 100+ other data columns, portfolio tools, and risk metrics—all included.

One platform. One subscription. Everything you need for data-driven investing.

See Pricing

Stop Drawing. Start Scanning.

14-day free trial. No credit card required. Full access to the complete FastTrack platform.

Try FastTrack Free